What even is varentropy?
October 17, 2024
Entropix aims to improves LLM token sampling by incorporating “varentropy” into its decision making.
According to the README, as of Oct 18, 2024:
When the entropy is high, you know to tread carefully, to ask clarifying questions, to help me find my way through the mist. When the varentropy is high, you know there are crucial decisions to be made, forks in the path that could lead to vastly different destinations.
I have solid intuitions about entropy. But what is varentropy?
I asked an LLM to write me some visualization code for entropy and varentropy in simplified conditions, using varentropy as implemented in the entropix repo.
Here’s a graph of entropy and varentropy for choosing between two outcomes. (LLMorse, anyone?)
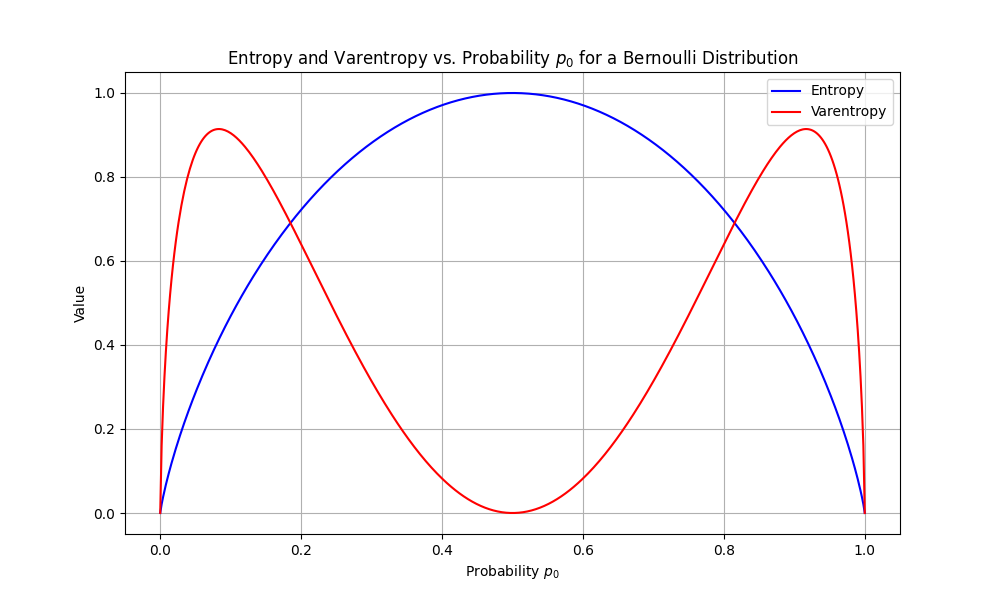
At 50/50 odds, entropy is at its highest (1 bit). We know nothing going in. At the extremes, entropy is 0, because the outcome is predetermined.
What does varentropy look like? It is zero at 50/50 and zero at the extremes. It is only high where we’re quite confident in the outcome (a bit over 90%), but not certain.
That doesn’t really match up well with the intuitive description of varentropy in the readme. These aren’t “forks in the path”.
Things often get way more interesting as you add dimensions. I had the LLM update the visualization to add one more outcome to the graph to see what happens.
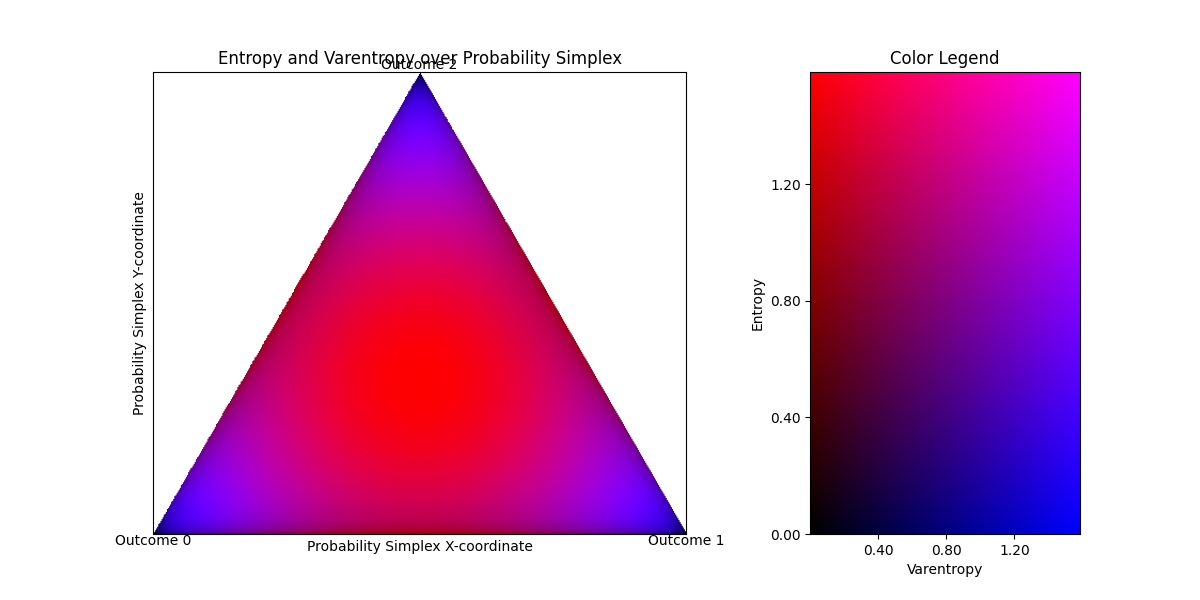
This is a bit harder to read, but each corner of the triangle corresponds to certainty in a particular outcome. The middle of the triangle is complete uncertainty. The color tells us both the entropy and varentropy. Black is low entropy, low varentropy. Red is high entropy, low varentropy. (The colorspace choices are clearly imperfect, but it’s enough to get a feel.)
This looks more or less the same as the two-outcome graph. Complete uncertainty is high entropy, low varentropy, including when we can mostly rule out one outcome but are uncertain between the other two. Complete certainty is low entropy, low varentropy (but it’s a tiny, tiny part of the graph now!). And high varentropy occurs when there’s a pretty clear choice, but not certain.
But the README says this:
High varentropy means I’m considering vastly different futures, different tones and directions. Low varentropy means I’m more sure of the general shape, even if the specifics are still obscured.
This doesn’t track.
Looking at these graphs, and staring at the varentropy calculation, this overall pattern will continue into higher dimensions.
I see no connection between the imagery and intuition in the README and the actual calculations in practice.
Maybe the imagery is misleading, but the usage is clear? According to the chart in the README, the sampler chooses between four options:
* Low entropy, low varentropy: Argmax / greedy
* Low entropy, high varentropy: Branch
* High entropy, low varentropy: Pause / chain-of-thought
* High entropy, high varentropy: Resample
It seems plausible that low entropy is a signal to sample greedily, and high entropy indicates you should do something more expensive. I see no particular reason to think that varentropy helps distinguish between which more expensive thing to do, though.
This doesn’t mean that the entropix sampler doesn’t work. I don’t know whether it does.
But if, empirically, the sampler yields superior results, that means one of three things is true:
- My failure to understand is just that.
- We need a better intuition for varentropy.
- We need a better understanding of why it works, one that might or might not have anything to do with varentropy.